No edit summary |
|||
| (One intermediate revision by the same user not shown) | |||
| Line 19: | Line 19: | ||
: <math>\displaystyle \frac{1+ 0+ 0+ 2+ 1+ 0+ 1+ 0+ 1+ 1}{10}=0.7</math>. |
: <math>\displaystyle \frac{1+ 0+ 0+ 2+ 1+ 0+ 1+ 0+ 1+ 1}{10}=0.7</math>. |
||
| − | This arithmetic mean is also displayed on the '''Card distribution per box''' tab of infoboxes on [[Pro Kit Box]] pages, together with the [[Sample maximum and minimum|minimum and maximum |
+ | This arithmetic mean is also displayed on the '''Card distribution per box''' tab of infoboxes on [[Pro Kit Box]] pages, together with the [[Sample maximum and minimum|minimum and maximum]] numbers of cards granted by the box so far. |
[[File:Deviations_example_Daily_Kit_Box.png|thumb|284px|right|Arithmetic means (red lines) for different card types in Daily Kit Boxes as of July 4, 2019]] The image to the right shows the tab for the Daily Kit Box as of July 4, 2019. On this date, the [[sample size]] of 890 cards was already much larger than the 10 cards of the above example, which leads to more a more precise value of 0.73 legendary cards per box. |
[[File:Deviations_example_Daily_Kit_Box.png|thumb|284px|right|Arithmetic means (red lines) for different card types in Daily Kit Boxes as of July 4, 2019]] The image to the right shows the tab for the Daily Kit Box as of July 4, 2019. On this date, the [[sample size]] of 890 cards was already much larger than the 10 cards of the above example, which leads to more a more precise value of 0.73 legendary cards per box. |
||
| Line 30: | Line 30: | ||
* The more boxes are opened, the closer the arithmetic means will get to the [[expected value]]s (see [[law of large numbers]]). |
* The more boxes are opened, the closer the arithmetic means will get to the [[expected value]]s (see [[law of large numbers]]). |
||
* If the expected values are set in relation to the total number of cards, they become [[drop rate]]s. |
* If the expected values are set in relation to the total number of cards, they become [[drop rate]]s. |
||
| + | |||
| + | == '''See also''' == |
||
| + | * [[Weighted arithmetic mean]] |
||
[[Category:Statistics]] |
[[Category:Statistics]] |
||
Revision as of 13:28, 18 July 2019
![]()
| SOURCE EDITOR ONLY! This page uses LaTeX markup to display mathematical formulas. Editing the page with the VisualEditor or Classic rich-text editor disrupts the layout. Do not even switch to one of these editors while editing the page! For help with mathematical symbols, see Mathematical symbols and expressions. |
In mathematics and statistics, the arithmetic mean, or simply the mean or average when the context is clear, is the sum of a collection of numbers divided by the count of numbers in the collection. The collection is often a set of results of an experiment or an observational study.
Definition
The arithmetic mean (read bar) is the mean of the values .


The arithmetic mean is the most commonly used and readily understood measure of central tendency in a data set. In statistics, the term average refers to any of the measures of central tendency. The arithmetic mean of a set of observed data is defined as being equal to the sum of the numerical values of each and every observation divided by the total number of observations. Symbolically, if we have a data set consisting of the values , then the arithmetic mean is defined by the formula:

If the data set is a statistical population (i. e., consists of every possible observation and not just a subset of them), then the mean of that population is called the population mean. If the data set is a statistical sample (a subset of the population), we call the statistic resulting from this calculation a sample mean.
The arithmetic mean is a special case of the weighted arithmetic mean in which all the weights are equal to each other.
Example
Consider an experiment where the amounts of legendary cards obtained from 10 ![]() Daily Kit Boxes † are counted: 1, 0, 0, 2, 1, 0, 1, 0, 1, 1. The arithmetic mean is
Daily Kit Boxes † are counted: 1, 0, 0, 2, 1, 0, 1, 0, 1, 1. The arithmetic mean is
- .

This arithmetic mean is also displayed on the Card distribution per box tab of infoboxes on Pro Kit Box pages, together with the minimum and maximum numbers of cards granted by the box so far.
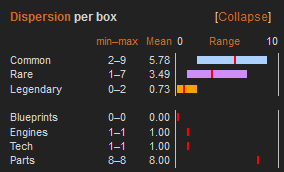
Arithmetic means (red lines) for different card types in Daily Kit Boxes as of July 4, 2019
The image to the right shows the tab for the Daily Kit Box as of July 4, 2019. On this date, the sample size of 890 cards was already much larger than the 10 cards of the above example, which leads to more a more precise value of 0.73 legendary cards per box.
While the min–max values from 0 to 2 (golden bar) show the possible range of legendary cards players can obtain, the arithmetic mean (red line) provides an orientation how many legendary cards they can expect on average. In this case, the average is not the exact middle of 0 and 2 (1), but less than one card: 0.73.
Generally, the bars around the red lines visualize the dispersion of cards, i. e. possible deviations from the mean. For example, a player will get an average of 5.78 common cards from a Daily Kit Box, but the result for one particular box can be very different: it can vary from 2 to 9 common cards. Large bars indicate large deviations, while small bars indicate that a particular result will not deviate much from the mean (like the amount of legendary cards in this example).
- If there is no bar at all around the red lines, there are no deviations. Minimum, maximum and mean values are identical, which indicates that the number of cards is not random, but fixed. This is the case for the amounts of Blueprints, Engines, Tech and Parts: Every single Daily Kit Box grants exactly 0 Blueprints, 1 Engine, 1 Tech and 8 Part cards.
- The more boxes are opened, the closer the arithmetic means will get to the expected values (see law of large numbers).
- If the expected values are set in relation to the total number of cards, they become drop rates.