- This article is about the mathematical background of daily ads. For general information, see Ad.
May 30, 2019 – Mar 4, 2020 | |||
|---|---|---|---|
| 1 Double Credits | 0 | 0.00 % | |
| 1 Nitro Starter | 302 | 13.25 % | |
| 1 Tuning Kit | 328 | 14.39 % | |
| 1 Extra Tank | 0 | 0.00 % | |
| 1 Optimal Shuffle Box | 263 | 11.54 % | |
| 1 Optimal Split Box | 301 | 13.20 % | |
| 474 | 20.79 % | ||
| 612 | 26.84 % | ||
| 1 Asterion or |
0 | 0.00 % | |
The stochastic process daily ads is a composed experiment in Asphalt 8. It consists of 10 trials that can be conducted once per day. The timer is reset at 0:00 UTC (not player's local time). The trials are connected with the gameplay element Daily ads: After a player has watched an ad, the process grants one of the possible rewards.
Sample space[]
The changes of May 30, 2019, have removed the Season Tickets and Lamborghini Egoista Blueprint from the list of possible rewards. The sample space of all possible outcomes is now
- 1
 Double Credits †
 - 1 Nitro Starter †
- 1 Tuning Kit †
- 1 Extra Tank †
- 1 Optimal Shuffle Box
- 1 Optimal Split Box
- 10
- 2,888
- 1 Lamborghini Asterion or 150,000 if a player already owns the car
Trials[]
After more than 200 trials (ads),
- it has been observed that there were days with no Credits, no Tokens, no boxes, or no boosters. There is no guarantee of getting these particular items on a single day.
- So far there have been no days without any kind of currency, so it is possible that there is a "grouped" guarantee of getting at least one kind of currency per day.
Statistics[]

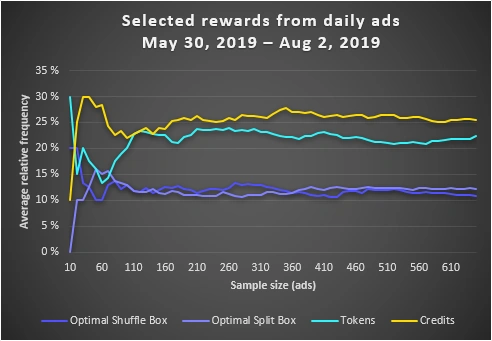
Example: Average relative frequencies of some rewards from daily ads since May 30, 2019.
There are no offical drop rates for daily ads.
But as the law of large numbers states that in the long run, the average relative frequency of an event converges almost surely to its expected value (= its drop rate), conclusions can be drawn from statistical data if the sample size is big enough.
Although the sample has reached an acceptable size of 200 ads, the average frequencies are not yet stable because of several events with high deviations. For example, it has been observed that the amount of Token rewards can vary from 0 to 50 % of a day's rewards. This also greatly influences the percentages of the other rewards and leads to the graphs taking longer to approach a straight line.
A rough oriention of approximate drop rates can be obtained from the bar chart at the top of this page. A frequency of 0 in the chart does not mean that the reward is not granted, but that the event did not occur during the particular run for the WikiProject Statistics database. Double Credits, for example, are still granted.[1]
Probabilities[]
Borel's law of large numbers asserts that for independent and identically distributed (i. i. d.) repetitions of a Bernoulli trial, the drop rate of an event almost surely converges to its probability on any particular trial.
If random variables are assigned to the event of obtaining each item (Double Credits, Nitro Starter, ...) , they can only take the values 1 (getting the item) or 0 (not getting it), so the respective trials are Bernoulli trials. However, it cannot be said at the moment if all trials have the same sample space and probability distribution, i. e. if every trial grants items with the same probabilities. If so, they would be i. i. d., which means that the drop rates also denote the probablitiy of getting an item from a particular single ad. See Daily Tasks rewards (stochastic process) for an in-depth example of probability calculations.
Previous versions[]
| Daily ads rewards Apr 9, 2019 – May 29, 2019 | |||
|---|---|---|---|
| 1 Lamborghini Egoista BP | 2 | 0.39 % | |
| 1 Double Credits | 1 | 0.20 % | |
| 1 Nitro Starter | 3 | 0.59 % | |
| 1 Tuning Kit | 5 | 0.98 % | |
| 1 Extra Tank | 1 | 0.20 % | |
| 3 Season Tickets | 163 | 31.96 % | |
| 1 Optimal Shuffle Box | 103 | 20.20 % | |
| 1 Optimal Split Box | 107 | 20.98 % | |
| 36 | 7.06 % | ||
| 89 | 17.45 % | ||
| 1 Asterion or |
0 | 0.00 % | |

.png)
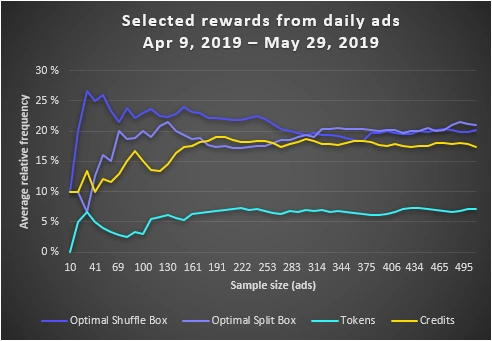
The 2019 Spring Update had changed the probabilities of daily ads rewards so that players started to get large amounts of Multiplayer season tickets, at the expense of boosters.
The Lamborghini Asterion reward still existed,[2] although the event did not occur during the particular run for the WikiProject Statistics database.
Due to the above-mentioned high deviations (in this case the amount of boxes, for example the Optimal Shuffle Box which could make up from 0 to 70 % of a day's rewards), the graphs took quite long to become smooth. Even then, outliers could still distort them (see the end of the graph for the Optimal Split Box in the chart to the right).
See also[]
External links[]
- My Post FLU Ad Rewards – Gameloft Forum thread where several players post their daily ad rewards
References[]
![]()
| The statistical data on this page is part of WikiProject Statistics. It contains original research which may be incomplete, incorrect or biased. |